2D transform
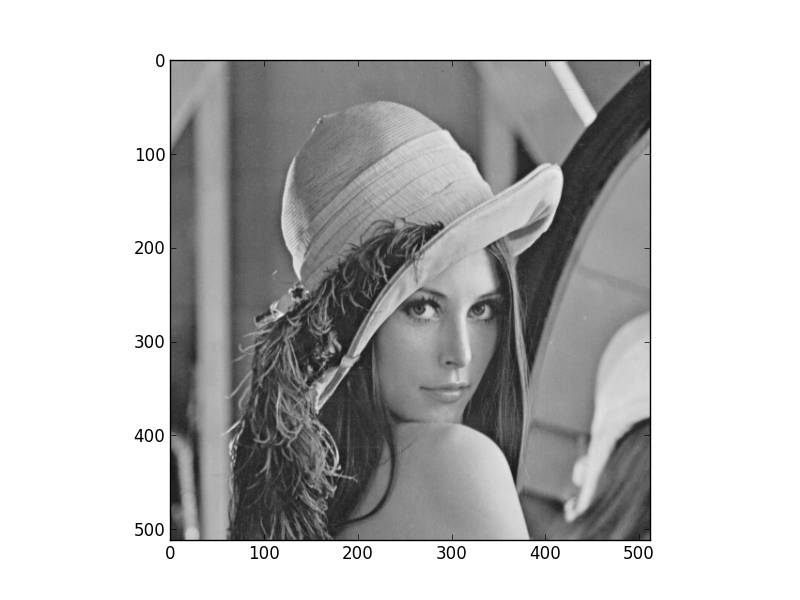
Using the pylab environment (part of matplotlib) we can perform a simple example where we transform the standard ‘Lena’ image and show the level 2 wavelet coefficients:
# Load the Lena image from the Internet into a StringIO object
from StringIO import StringIO
from urllib2 import urlopen
LENA_URL = 'http://www.ece.rice.edu/~wakin/images/lena512.pgm'
lena_file = StringIO(urlopen(LENA_URL).read())
# Parse the lena file and rescale to be in the range (0,1]
from scipy.misc import imread
lena = imread(lena_file) / 255.0
from matplotlib.pyplot import *
import numpy as np
# Show lena on the left
figure(1)
imshow(lena, cmap=cm.gray, clim=(0,1))
import dtcwt
# Compute two levels of dtcwt with the defaul wavelet family
Yh, Yl = dtcwt.dtwavexfm2(lena, 2)
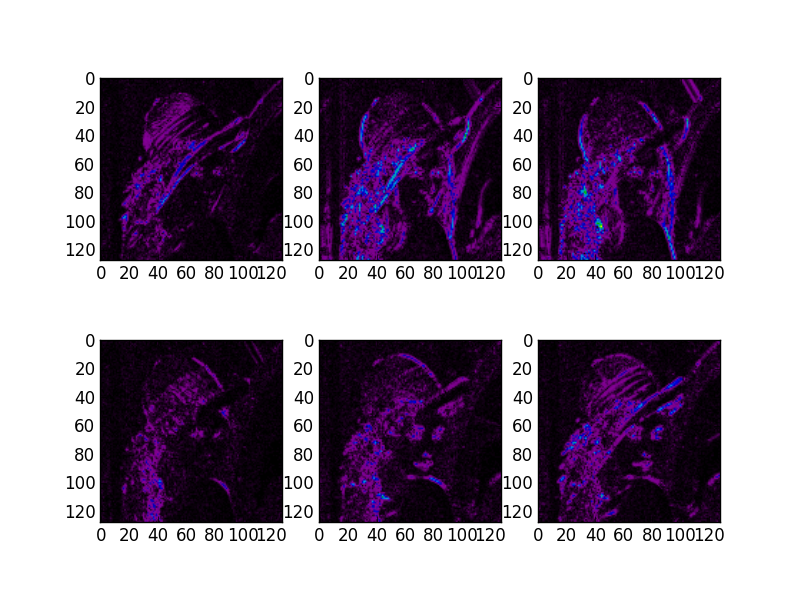
# Show the absolute images for each direction in level 2.
# Note that the 2nd level has index 1 since the 1st has index 0.
figure(2)
for slice_idx in xrange(Yl[1].shape[2]):
subplot(2, 3, slice_idx)
imshow(np.abs(Yl[1][:,:,slice_idx]), cmap=cm.spectral, clim=(0, 1))
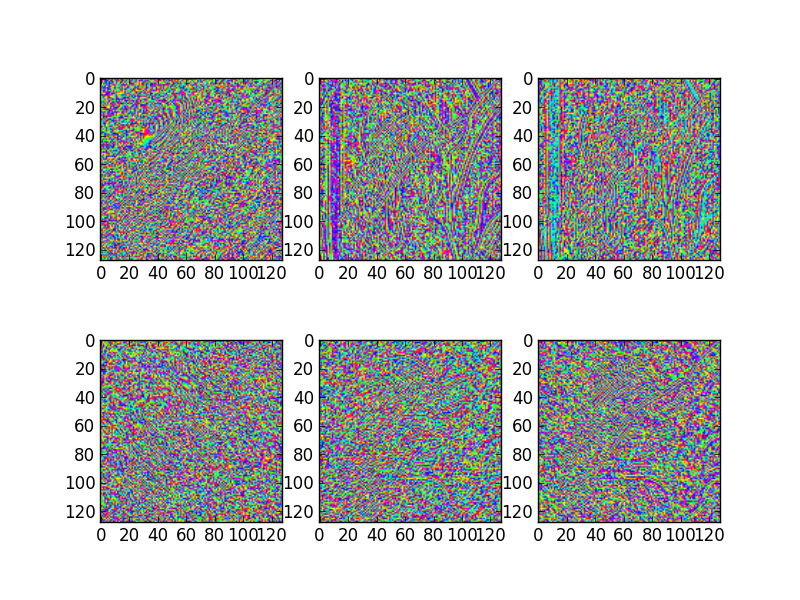
# Show the phase images for each direction in level 2.
figure(3)
for slice_idx in xrange(Yl[1].shape[2]):
subplot(2, 3, slice_idx)
imshow(np.angle(Yl[1][:,:,slice_idx]), cmap=cm.hsv, clim=(-np.pi, np.pi))
show()
If the library is correctly installed and you also have matplotlib installed, you should see these three figures: