2D transform
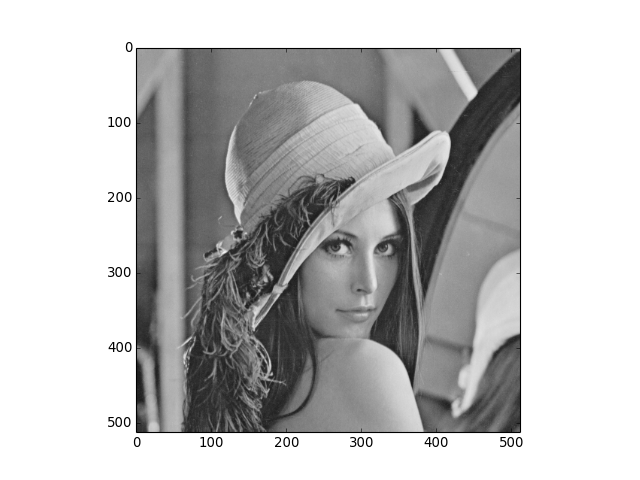
Using the pylab environment (part of matplotlib) we can perform a simple example where we transform the standard ‘Lena’ image and show the level 2 wavelet coefficients:
# Load the Lena image
lena = datasets.lena()
# Show lena
figure(1)
imshow(lena, cmap=cm.gray, clim=(0,1))
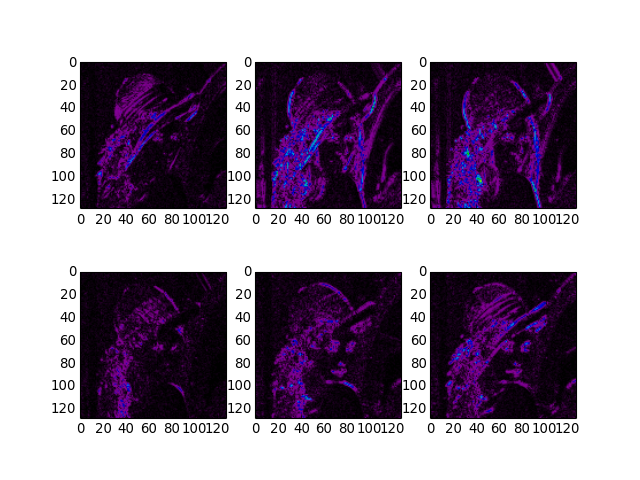
import dtcwt
transform = dtcwt.Transform2d()
# Compute two levels of dtcwt with the defaul wavelet family
lena_t = transform.forward(lena, nlevels=2)
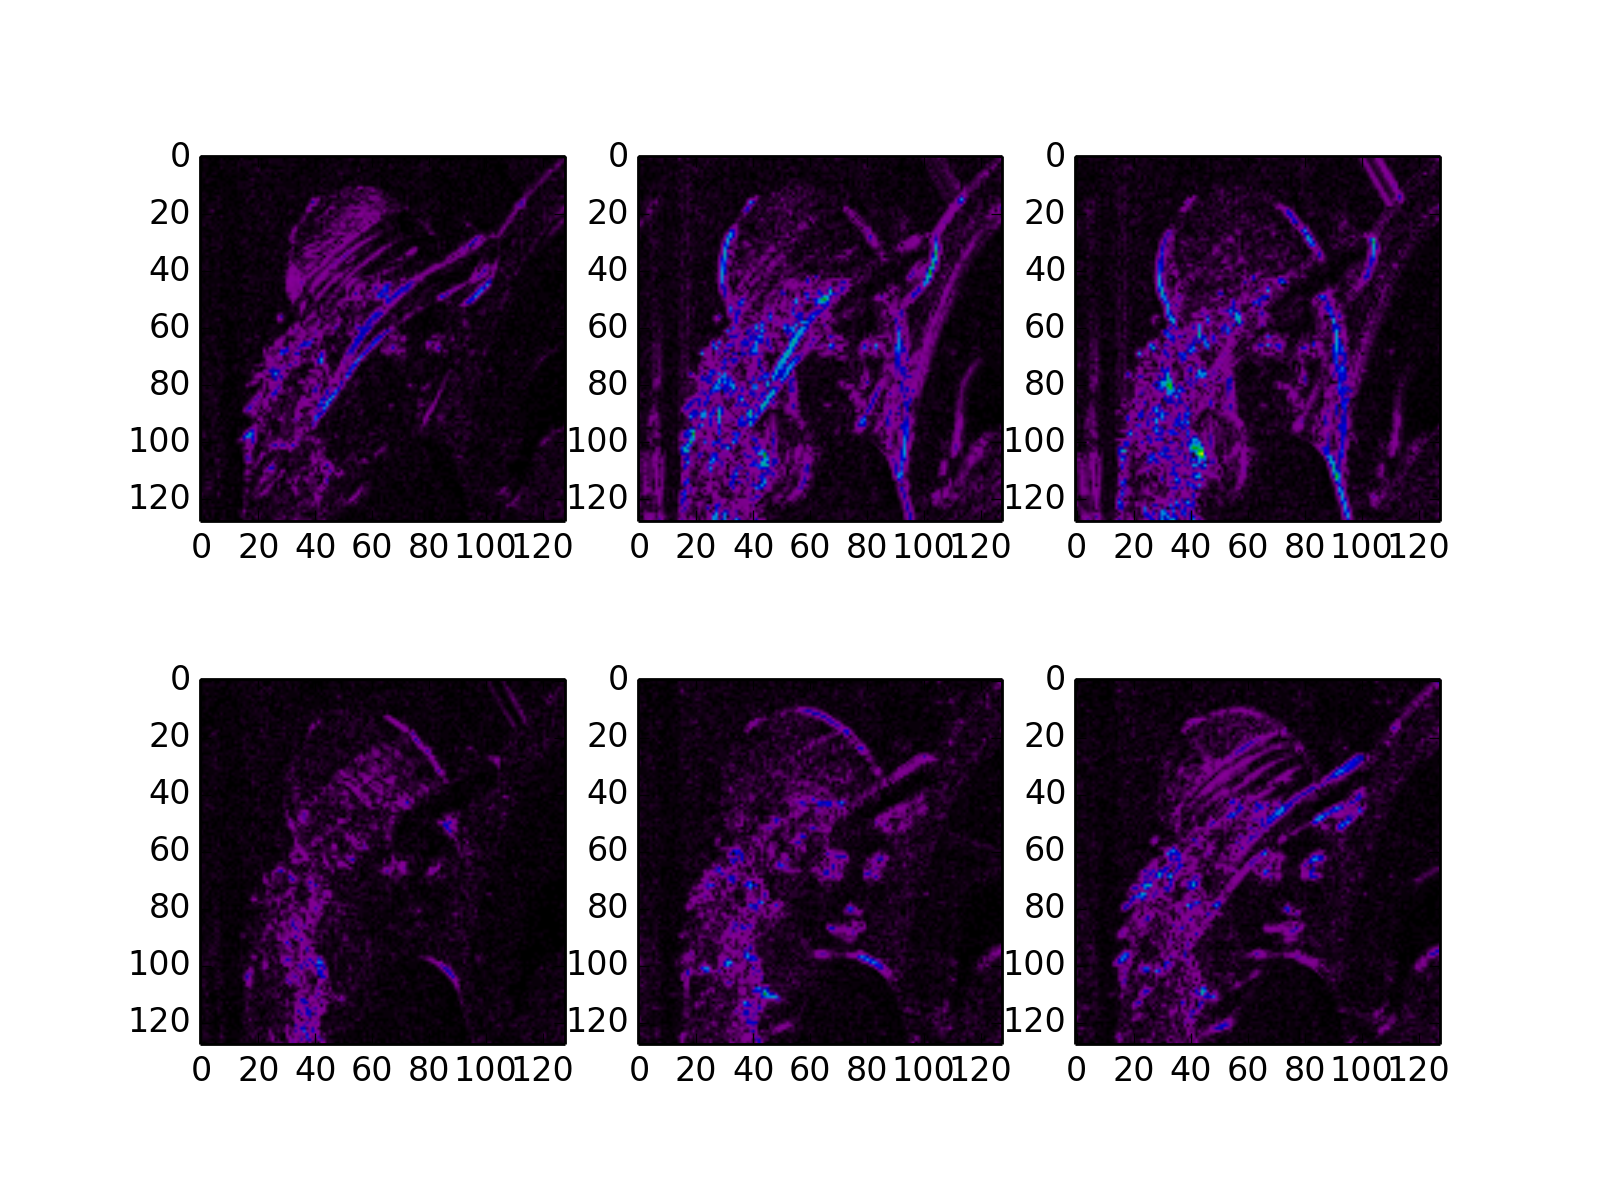
# Show the absolute images for each direction in level 2.
# Note that the 2nd level has index 1 since the 1st has index 0.
figure(2)
for slice_idx in range(lena_t.highpasses[1].shape[2]):
subplot(2, 3, slice_idx)
imshow(np.abs(lena_t.highpasses[1][:,:,slice_idx]), cmap=cm.spectral, clim=(0, 1))
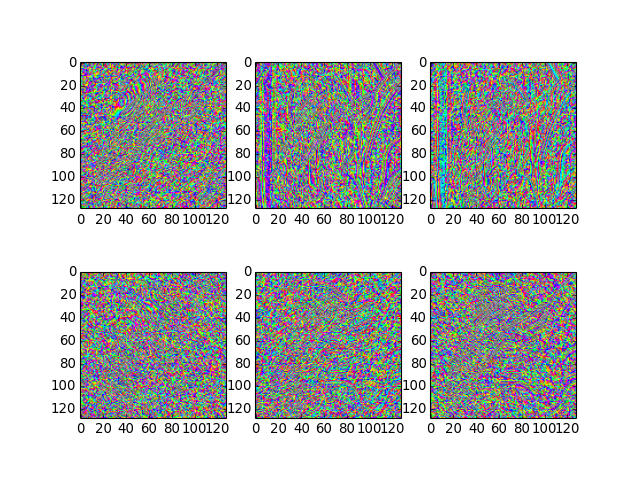
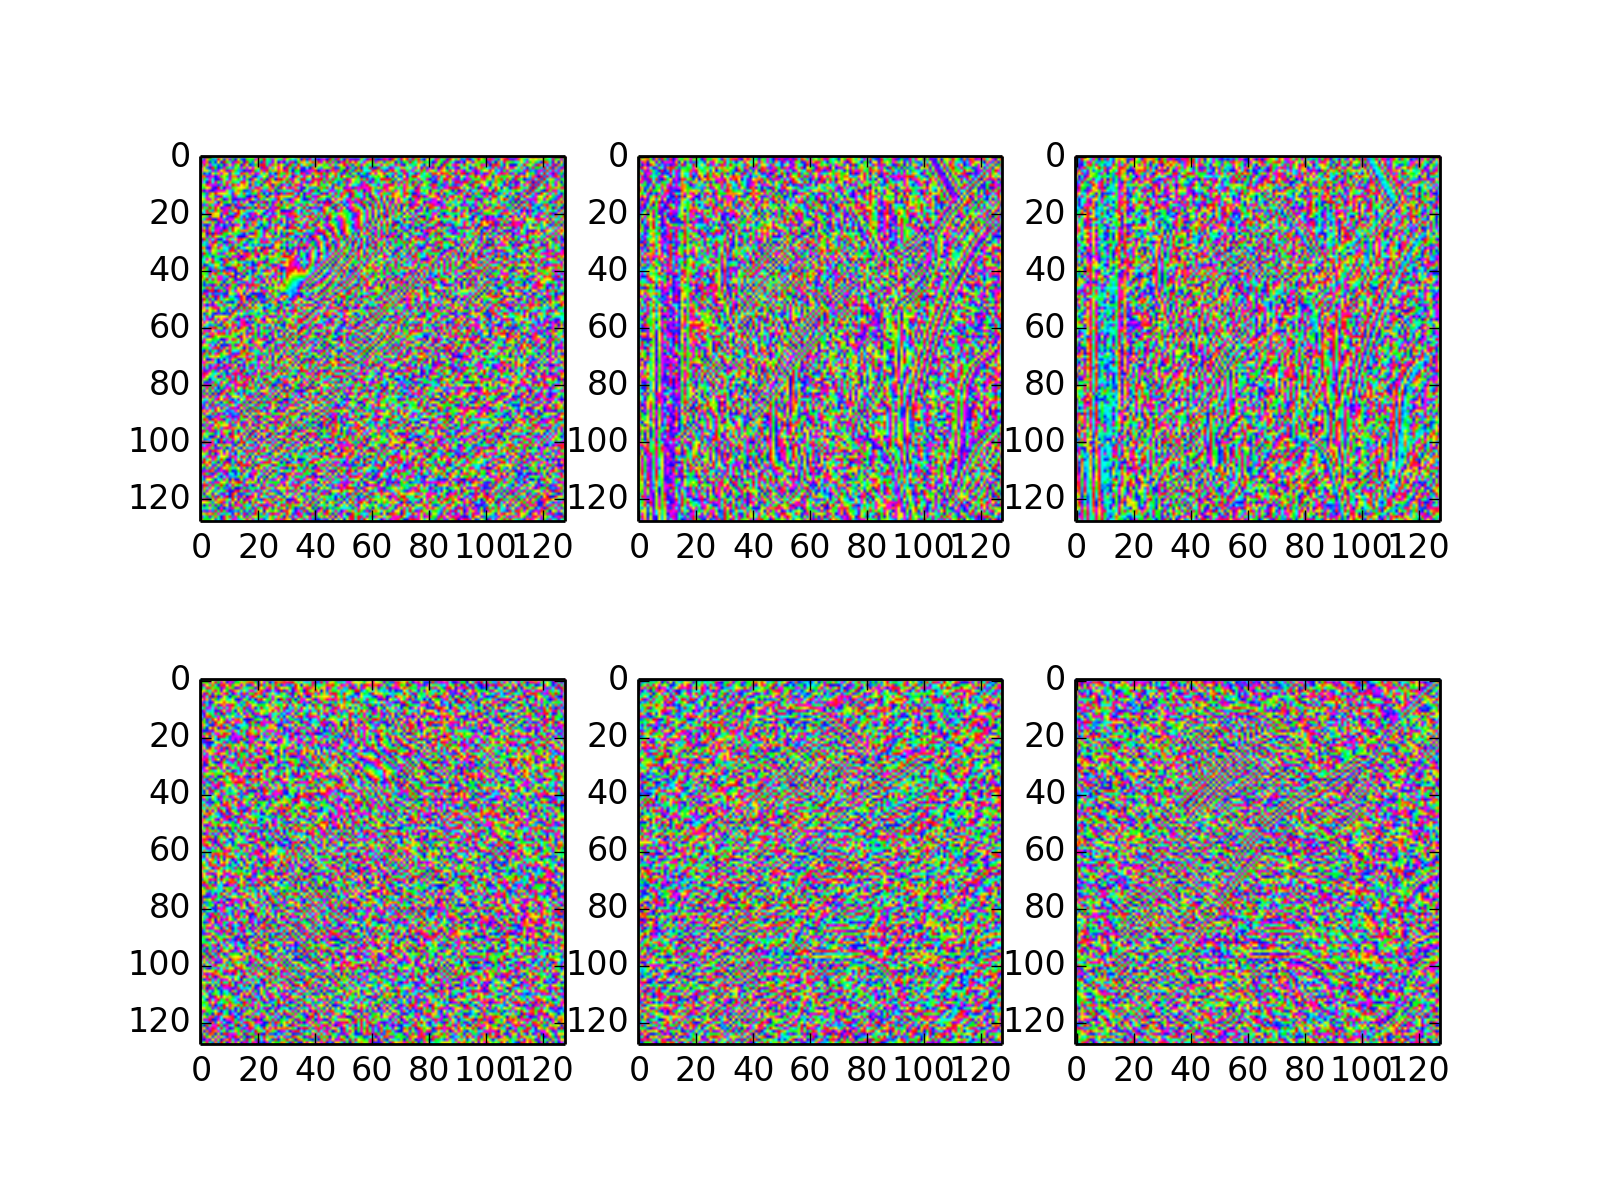
# Show the phase images for each direction in level 2.
figure(3)
for slice_idx in range(lena_t.highpasses[1].shape[2]):
subplot(2, 3, slice_idx)
imshow(np.angle(lena_t.highpasses[1][:,:,slice_idx]), cmap=cm.hsv, clim=(-np.pi, np.pi))
